| Search |
Line and Pie Charts Plugin
It makes it easy to add interactive, mobile-optimised charts to your web and mobile projects.
Creating Chart
1. In the Control Panel, select PLUGINS / Line and Pie Charts.
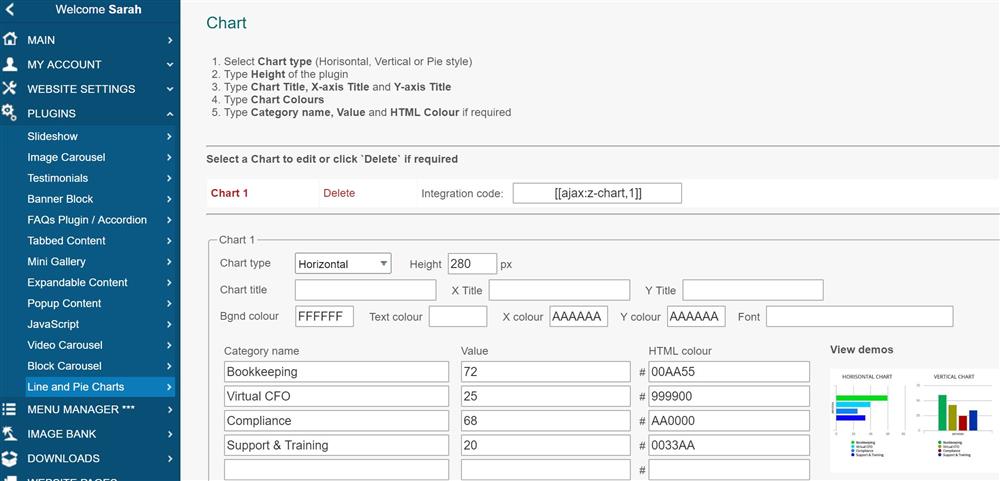
2. Select Chart to edit or create a new one.
3. Select Chart type (Horisontal, Vertical or Pie style).
4. Type Height of the plugin.
5. Type Chart Title, X-axis Title and Y-axis Title.
6. Type Chart Colours if you need your own.
6. Type Category name, Value and HTML Colour if required
Integrating a Chart into the page
To integrate this plugin into the web page, you need to type its integration code:
[ [ajax:z-chart,2] ]
Where:
2 - Chart ID
Examples